


primeimages/E+ via Getty Images
Narrow market breadth is in view as the S&P 500 (SP500)(SPY) continues to score record highs in 2024.
The large-cap index on Tuesday marked its 36th record closing high for the year by edging up ~0.1% to 5,576.98. The index has bulked up +17% YTD, and on Wednesday, it was moving toward a seventh consecutive win.
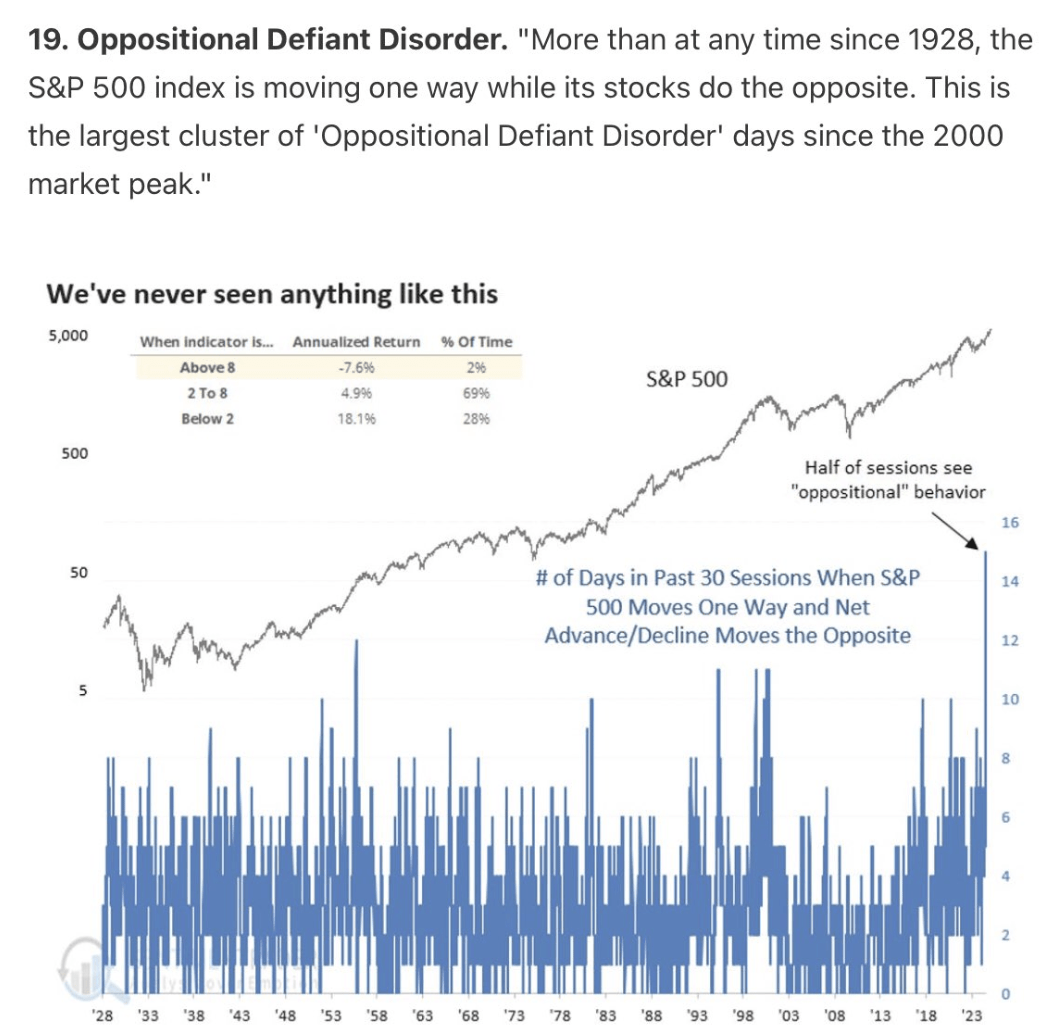
But more than at any time since 1928, the S&P 500 (SP500) is “moving one way while its stocks do the opposite,” according to a chart from investment research firm SentimenTrader. Societe Generale Global Strategist Albert Edwards in a Wednesday message on X credited the chart to SentimenTrader Founder and Chief Research Analyst Jason Goepfert.
“Oppositional Defiant Disorder” is how SentimenTrader characterized what’s happening underneath the S&P 500’s (SP500)(VOO) hood. Its chart highlighted that the S&P 500 in 14 of the past 30 days has moved one way while net advance/decline – an indicator of market breadth – has moved in the opposite direction. Here’s the chart:
So far this year, roughly 40% of the S&P 500’s (SP500) 503 components have lost ground.
“The equity market’s behaviour is particularly ‘ODD’ at the moment, reflecting a market having sprinted to a record altitude and now it’s gasping for ‘breadth’,” Edwards said in his X post.
Among this year’s winners have been mega-cap tech stocks including Nvidia (NVDA), with its 171% surge. Microsoft (MSFT), the stock with the heaviest index weighting, has risen 22% YTD.
ETFs that track the S&P 500 include (IVV), (SSO), and (SPXU).